
Image
Video
Pro.Lean©
Movicon
Pro.Lean allows you to communicate with any field system or equipment, collect and log data in a database to analyze key performance indicators (KPIs), calculate overall equipment effectiveness (OEE), and measure downtime. Pro.Lean software solutions feature open architecture and simplified configuration to reduce losses and significantly increase profits in every Industry 4.0 deployment.
Product details
Capacity Data Dashboard
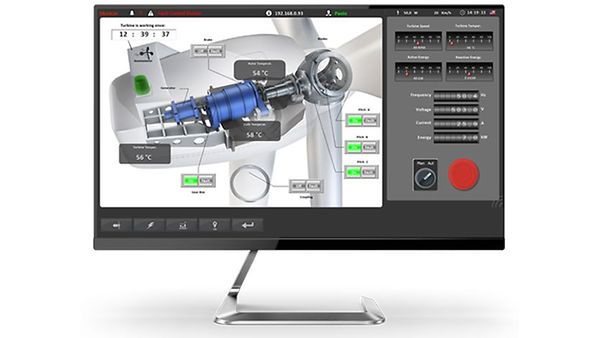
Pro.Lean© displays real-time data on a dashboard designed with modern ergonomics to display metrics and equipment operating status in intuitive, detailed graphics. The web functionality of the graphical interface enables operators to easily control the production process in real time from any location.
By integrating advanced management and command functions, supervisory functions can be implemented on the module, and the dashboard can be customized as needed.
Performance, OEE, KPI
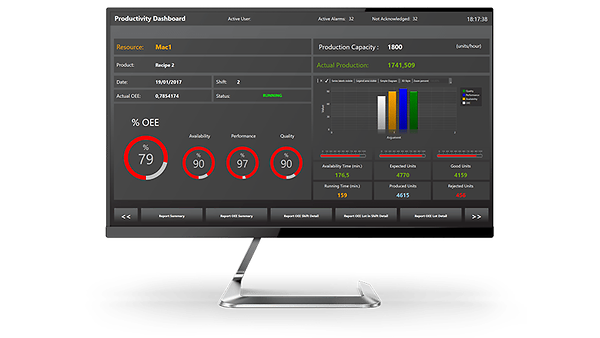
The Overall Equipment Effectiveness (OEE) metric is considered an effective key metric for measuring overall plant efficiency. Factories can maximize sales by increasing capacity in three areas: availability, performance and quality. Pro.Lean© achieves this goal in a cost-effective way.
The Pro.Lean© module leverages Movicon functionality to display OEE metrics and key performance indicators (KPIs) in real time and generate reports based on new and archived data for the corresponding shift, operator, machine, product or batch. Manufacturers can gain new insights into the actual throughput of systems, production lines and equipment. Pro.Lean provides all the information you need to easily identify and resolve inefficiencies, improving overall plant efficiency.
Downtime analysis
The Downtime Analysis module displays production downtime statistics categorized by duration and frequency. Values are retrieved from historical logs and presented graphically based on time period, batch, shift and operator filter types. These graphic presentations use histograms or overlaid statistical curves to display data in a meaningful way and provide printing options. In addition to statistical calculations and graphical presentation, the system can display summary tables with filtered data in a detailed report format.